Video Graphics
Well, I've still given up on the TV out and the video encoder, but I did have a bit of success with the rest of the video system. Seems that writing the video code using the register names did pay off after-all.
So instead of enjoying another fantastic, if a little warm, day outside, i've been hacking away (seriously, it must some sort of addiction) at some sort of video/graphics interface. And all i've had to eat today so far is beer ...
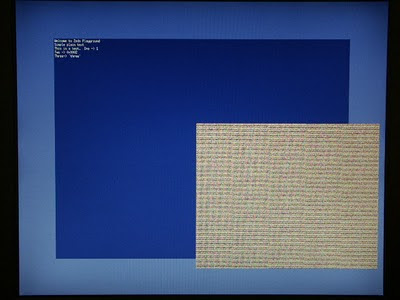
I added code to set various video modes - all the basic ones up to 1280x1024. Since i'm using a fixed clock with an integer divider, most of the pixel clocks are wrong, but they work with my monitor as they are 'close enough'. I also separated out the graphics part from the video part, so I can use the hardware more fully, as below.
Anyway, obligatory screen-shot, then some explanation.
First, the video mode is set to 1280x1024, with a light-blue background colour. That's all it will display, until I add a graphical channel.
The dark-blue graphical channel is using channel 0 - the 'graphics' channel, in RGB16 format at 1024x768 resolution, centered on the main video window.
Then the noisy rectangle is using channel 2, again in RGB16 format, although it could also be in UYVU or YUV2 format. i.e. it is a 'video overlay'.
I'll upload it somewhere soon - maybe this week.
Debugging
To help with debugging i've come up with a couple ideas too. First, when I get a fatal exception I now jump to a little 'crash monitor' that lets me examine memory. Well that's all I do now, but it can always be extended. But even that has proven quite handy, e.g. to examine (more of) the stack.
Exception: Data Abort
 pc: 0x80009f00 sr: 0x200001d3
 r0: 0x00000020
 r1: 0x00000040
 r2: 0x48050400
 r3: 0x00000040
 r4: 0x48050400
 r5: 0x480504a0
 r6: 0x80e3fd84
 r7: 0x00000002
 r8: 0x48050400
 r9: 0x00000054
r10: 0x00000002
r11: 0x80e3fdbc
r12: 0x00000066
r13: 0x80e3fd70 0x00000008 0x00000000 0x80e3fe14 0x80009ff4 0x80e3fe14 0x80009b08 0x72747300 0x00797063
r14: 0x80e3fd7c
r15: 0x80009f00
Entering crappy crash monitor.
 ? for help.
#> ?
?               help
m addr len      Show memory as words from addr for len words
#> m 0x80e3fd70 22

0x80e3fd70: 0x00000008 0x00000000 0x80e3fe14 0x80009ff4 0x80e3fe14 0x80009b08 0x72747300 0x00797063
0x80e3fd90: 0x74757064 0x6d6d0063 0x6c665f75 0x5f687375 0x00424c54 0x646e6573 0x7274735f 0x00676e69
0x80e3fdb0: 0x00000001 0x80200000 0x80200000 0x00000280 0x00000200 0x00000000
#>
The second is a sort of crash analyser, that turns addresses into functions. Basically, it takes the output of `objdump -d', and a list of addresses, and then turns them into the function the address resides in, and optionally the assembly language of the function. I've just been using `objdump | less' to do the same thing manually for individual addresses, but once you get more than a couple it gets tedious.
#> m 0x80e3fa00 64
0x80e3fa00: 0x80e3fab8 0x00000000 0x00000000 0x8000c394 0x00000010 0x80022940 0x00000000 0x00000000
0x80e3fa20: 0x00000000 0x8000b89c 0x80e3fab8 0x00000200 0x00000000 0x8000ba68 0x80e3fab8 0x00000200
0x80e3fa40: 0xffffffff 0x00000000 0x00000000 0x8000d0ec 0x80e3fab8 0x00000200 0x00000000 0x80022d68
0x80e3fa60: 0x00000000 0x8000b89c 0x80e3fab8 0x00000200 0x00000000 0x8000ba68 0x80e3fab8 0x00000200
0x80e3fa80: 0x00000010 0x00000000 0x00000000 0x80013294 0x80e3fab8 0x00000200 0x00000003 0x00000000
0x80e3faa0: 0x80e3fcd8 0x81204148 0x00000001 0x80013620 0x80e3fab8 0x00000001 0x00000013 0x000001e1
0x80e3fac0: 0x00000002 0x00000200 0xffffffff 0x00000001 0x00e3fb02 0x80022752 0x8004730b 0x80e3fb00
0x80e3fae0: 0x00000032 0x80008a84 0x80e3fb00 0x80046258 0x00000000 0x00000001 0x812040a0 0x8000851c
Dump that to a file on my workstation, then process it:
$ cat > a
0x80e3fa00: 0x80e3fab8 0x00000000 0x00000000 0x8000c394 0x00000010 0x80022940 0x00000000 0x00000000
 ...
$  cat a | while read line ; do ./crashdump -3 haiku-dump.text $line ; done
8000c31c <_ZN10MemoryDisk6ReadAtEPvxS0_m>:
                ...
8000c388:       e0811004        add     r1, r1, r4
8000c38c:       e1a02006        mov     r2, r6
8000c390:       ebfffba6        bl      8000b230 <memcpy>
                ...
8000b86c <_ZN10Descriptor6ReadAtExPvm>:
                ...
8000b890:       e1a0000c        mov     r0, ip
8000b894:       e1a0e00f        mov     lr, pc
8000b898:       e594f010        ldr     pc, [r4, #16]
                ...
8000ba28 <read_pos>:
                ...
8000ba5c:       e1a02004        mov     r2, r4
8000ba60:       e1a03005        mov     r3, r5
8000ba64:       ebffff80        bl      8000b86c <_ZN10Descriptor6ReadAtExPvm>
                ...
8000d050 <_ZN4boot9Partition6ReadAtEPvxS1_m>:
                ...
8000d0e0:       e0922004        adds    r2, r2, r4
8000d0e4:       e0a33005        adc     r3, r3, r5
8000d0e8:       ebfffa4e        bl      8000ba28 <read_pos>
                ...
8000b86c <_ZN10Descriptor6ReadAtExPvm>:
                ...
8000b890:       e1a0000c        mov     r0, ip
8000b894:       e1a0e00f        mov     lr, pc
8000b898:       e594f010        ldr     pc, [r4, #16]
                ...
8000ba28 <read_pos>:
                ...
8000ba5c:       e1a02004        mov     r2, r4
8000ba60:       e1a03005        mov     r3, r5
8000ba64:       ebffff80        bl      8000b86c <_ZN10Descriptor6ReadAtExPvm>
                ...
80013218 <_ZN18PartitionMapParser19_ReadPartitionTableExP15partition_table>:
                ...
80013288:       e0962004        adds    r2, r6, r4
8001328c:       e0a73005        adc     r3, r7, r5
80013290:       ebffe1e4        bl      8000ba28 <read_pos>
                ...
800135c8 <_ZN18PartitionMapParser5ParseEPKhP12PartitionMap>:
                ...
80013614:       e3a02000        mov     r2, #0  ; 0x0
80013618:       e3a03000        mov     r3, #0  ; 0x0
8001361c:       ebfffefd        bl      80013218 <_ZN18PartitionMapParser19_ReadPartitionTableExP15partition_table>
                ...
80008a00 <serial_puts>:
                ...
80008a78:       ebffffda        bl      800089e8 <serial_putc>
80008a7c:       e1a00007        mov     r0, r7
80008a80:       ebffffd8        bl      800089e8 <serial_putc>
                ...
800084e0 <dprintf>:
                ...
80008510:       a1a01003        movge   r1, r3
80008514:       e1a0000d        mov     r0, sp
80008518:       eb000138        bl      80008a00 <serial_puts>
                ...
Which is a lot more meaningful than a list of addresses.
Update: both of these are in the puppy bits project
Hmm, time to go in search of food I think.
Oh, turns out I was booting the wrong image with haiku ... so that splash screen really was less than it seemed. However once I changed to using the correct image, I get pretty much the same result - a pretty face but no brains.

