JNI, memory, etc.
So a never-ending hobby has been to investigate micro-optimisations for dealing with JNI memory transfer. I think this is at least the 4th post dedicated soley to the topic.
I spent most of the day just experimenting and kinda realised it wasn't much point but I do have some nice plots to look at.
This is testing 10M calls to a JNI function which takes an array - either byte[] or a ByteBuffer. In the first case these are pre-allocated outside of the loop.
The following tests are performed:
- Elements
-
Uses Get/SetArrayElements, which on hotspot always copies the memory to a newly allocated block.
- Range alloc
-
Uses Get/SetArrayRegion, and inside the JNI code always allocates a new block to store the transferred data and frees it on exit.
- Critical
-
Uses Get/ReleasePrimitiveArrayCritical to access the JVM memory directly.
- ByteBuffer
-
Uses the JNIEnv entry points to retrieve the memory base location and size.
- Range
-
Uses Get/SetArrayRegion but uses a pre-allocated (bss) buffer.
- ByteBuffer field
-
Uses GetLongField and GetIntField to retrieve the package/private address and size values directly from the Buffer object. This makes it non portable.
I'm running it on a Kaveri APU with JDK 1.8.0-b129 with default options. All plots are generated using gnuplot.
Update: I came across this more descriptive summary of the problem at the time, and think it's worth a read if you're ended up here somehow.
Small arrays
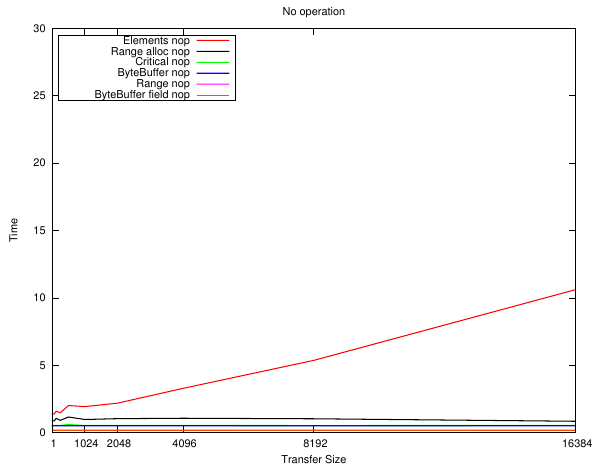
The first plot shows a 'no operation' JNI call - the pointer to the memory and the size is retrieved but it is not accessed. For the Range cases only the length is retrieved.
What can be seen is that the "ByteBuffer field" implementation has the least overhead - by quite a bit compared to using the JNIEnv entry points. From the hotspot source it looks like they perform type checks which are adding to the cost.
Also of interest is the "Range alloc" plot which only differs from the "Range" operation by a malloc()/free() pair. i.e. the JNI call invocation overhead is pretty much insignificant compared to how willy-nilly C programmers throw these around. This is also timing the Java loop as well of course. The "Range" call only retrieves the array size in this case although interestingly that is slower than retrieving the two fields.
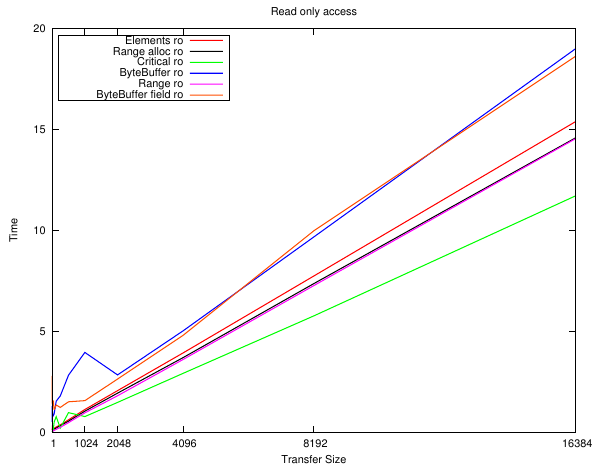
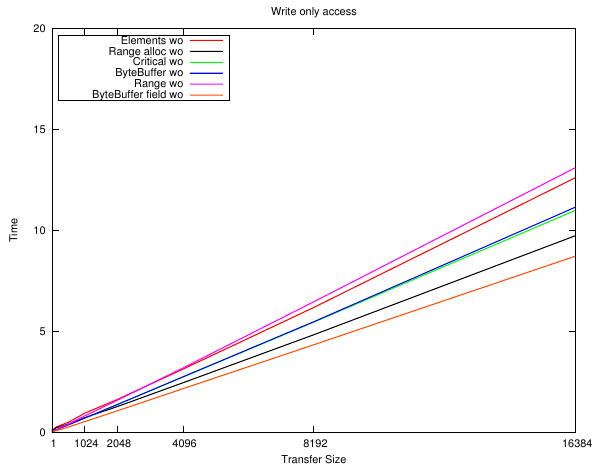
The next series of plots are for implementing a dummy 'load'. The read load is to add up every byte in the array, and the write load is to write the array index to the array. It's not particularly important just that it accesses the memory.
Well, they're all pretty close and follow the overhead plot as you would expect them to. The only real difference is between the implementations that need to allocate the memory first - but small arrays can be stored on the stack 'for free'.
The only real conclusion is: don't use GetArrayElements() or malloc space for short arrays!
Larger arrays
This is the upper area of the same plots above.
Here we see that by 8K the overhead of the malloc() is so insignificant to the small amount of work being performed that it vanishes from the time - although GetArrayElements() is still a bit slower. The Critical and field-peeking ByteBuffer edge out the rest.
And now some strange things start to happen which don't seem to have an obvious reason. Writing the data to bss and then copying it using SetArrayRegion() has become the slowest ... yet if the memory is allocated first it is nearly the fastest?
And even though the only difference between the ByteBuffer variants is how it resolves Buffer.address and Buffer.capacity ... there is a wildly different performance profile.
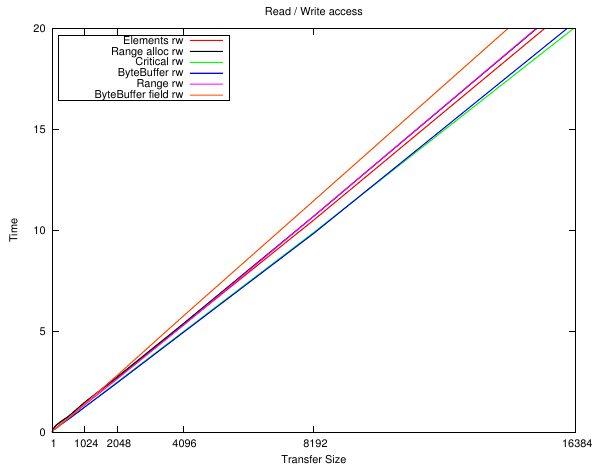
And now even more weirdness. Performing a read and then a write ... results in by far the worst performance from accessing a ByteBuffer using direct field access, yet just about the best when going through the JNIEnv methods. BTW the implementation rules out most cache effects - this is exactly the same memory block at exactly the same location in each case, and the linearity of the plot shows it isn't size related either.
And now GetArrayElements() beats GetArrayRetion() ...
I have no idea on this one. I re-ran it a couple of times and checked the code but perhaps I missed something.
Dynamic memory
Perhaps it's just not a very good benchmark. I also tried an extreme case of allocating the Java memory inside the loop - which is another extreme case. At least these should give some bracket.
Here we see Critical running away with it, except for the very small sizes which will be due to cache effects. The ByteBuffer results show "common knowledge" these things are expensive to allocate (much more so than malloc) so are only suitable for long-lived buffers.
Again with the SetArrayRegion + malloc stealing the show. Who knows.
It only gets worse for the ByteBuffer the more work that gets done.
The zoomed plots look a bit noisy so i'm not sure they're particularly valid. They are similar to the pre-allocated version except the ByteBuffer versions are well off the scale at that size.
After all this i'm not sure what conclusions to draw. Well for one OpenCL has so many other overheads I don't think any of these won't even be a rounding error ...
Invocation
I also did some playing around with native method invocation. The goal is just to get a 'pointer' to a native resource in the JNI and just to compare the relative overheads. The calls just return it so it isn't optimised out. Each case is executed for 100M times and this is the result of a fourth run.
- call
-
This is what I used in zcl. An object method is invoked and the instance method retrieves the pointer from 'this.p'.
- calle
-
The same but the call is wrapped in a try { } catch { } with in the loop and the method declares it throws an exception.
- callp
-
An instance method where an anonymous pointer is passed to the JNI.
- calls
-
A static method which takes the object as a parameter. The JNI retrieves 'this.p'.
- callsp
-
This is the commonly used approach whereby an anonymous pointer is passed as a parameter to a static method.
The three types are the type of pointer. I was going to test this on a 32-bit platform but ran out of steam so the integers don't make much difference here. int and long are just a simple type and buffer stores a 'struct' as a ByteBuffer. This latter is how I originally implemented jjmpeg but clearly that was a mistake.
Results
    type    call    calle   callp   calls   callsp

    int     1.062   1.124   0.883   1.100   0.935
    long    1.105   1.124   0.883   1.101   0.936
    buffer  5.410   5.401   2.639   5.365   2.631
The results seemed pretty sensitive to compilation - each function is so small so there may be some margin of error.
Anyway the upshot is that there's no practical performance difference across all implementations and so the decision on which to use can be based on other factors. e.g. just pass objects to the JNI rather than the mess that passing opaque pointers create.
And ... I think that it might be time for me to leave this stuff behind for good.


